Social network graphs are pretty, but they’re not the only way we can try to visualized cross-institutional research collaborations. Here’s a geographic view of some of the institutions that UCSF dentistry researchers have co-authored with over the course of 2013.
UCSF dentistry collaborations, visualized
Looking at cross-institutional co-authorship networks is a useful way of seeing not only who we work with, but also where there may be gaps of interest.
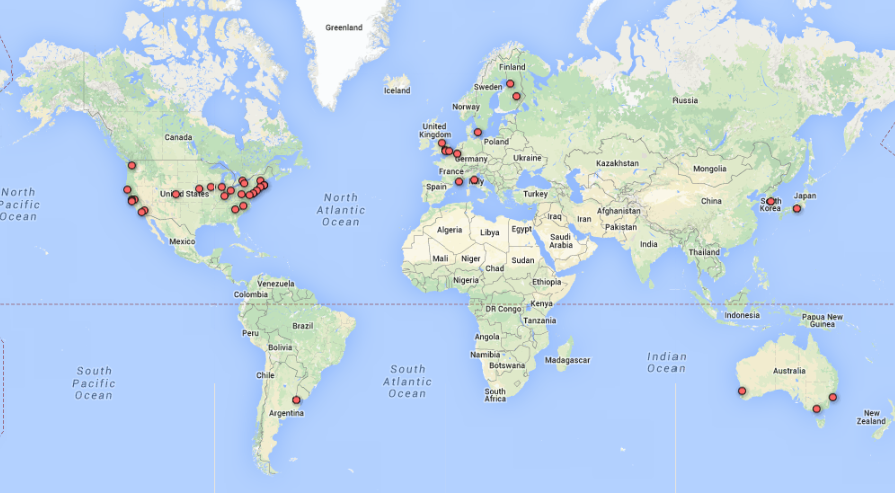
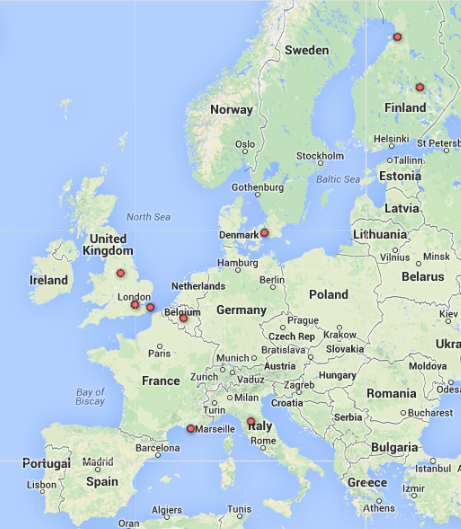
I first looked at dentistry-related publications by UCSF researchers published in 2013, breaking out the institutions we co-authored with. And there we are, sitting pretty in the center of our universe, collaborating with major institutions in the US, Korea, Australia, Italy, Denmark, and more.
(Details: Institution node sizes indicate the total volume of dentistry-related articles published. Connecting line widths indicate the number of articles co-authored between two institutions. Distance between nodes indicates the tightness of co-authorship networks, and different sets of node colors help distinguish groups of institutions whose researchers frequently co-author together. Of 462 institutions that collaborated with UCSF researchers, we’re showing only 91 that had 10 or more cross-institutional articles in that time.)
View full-size visualization (PDF)
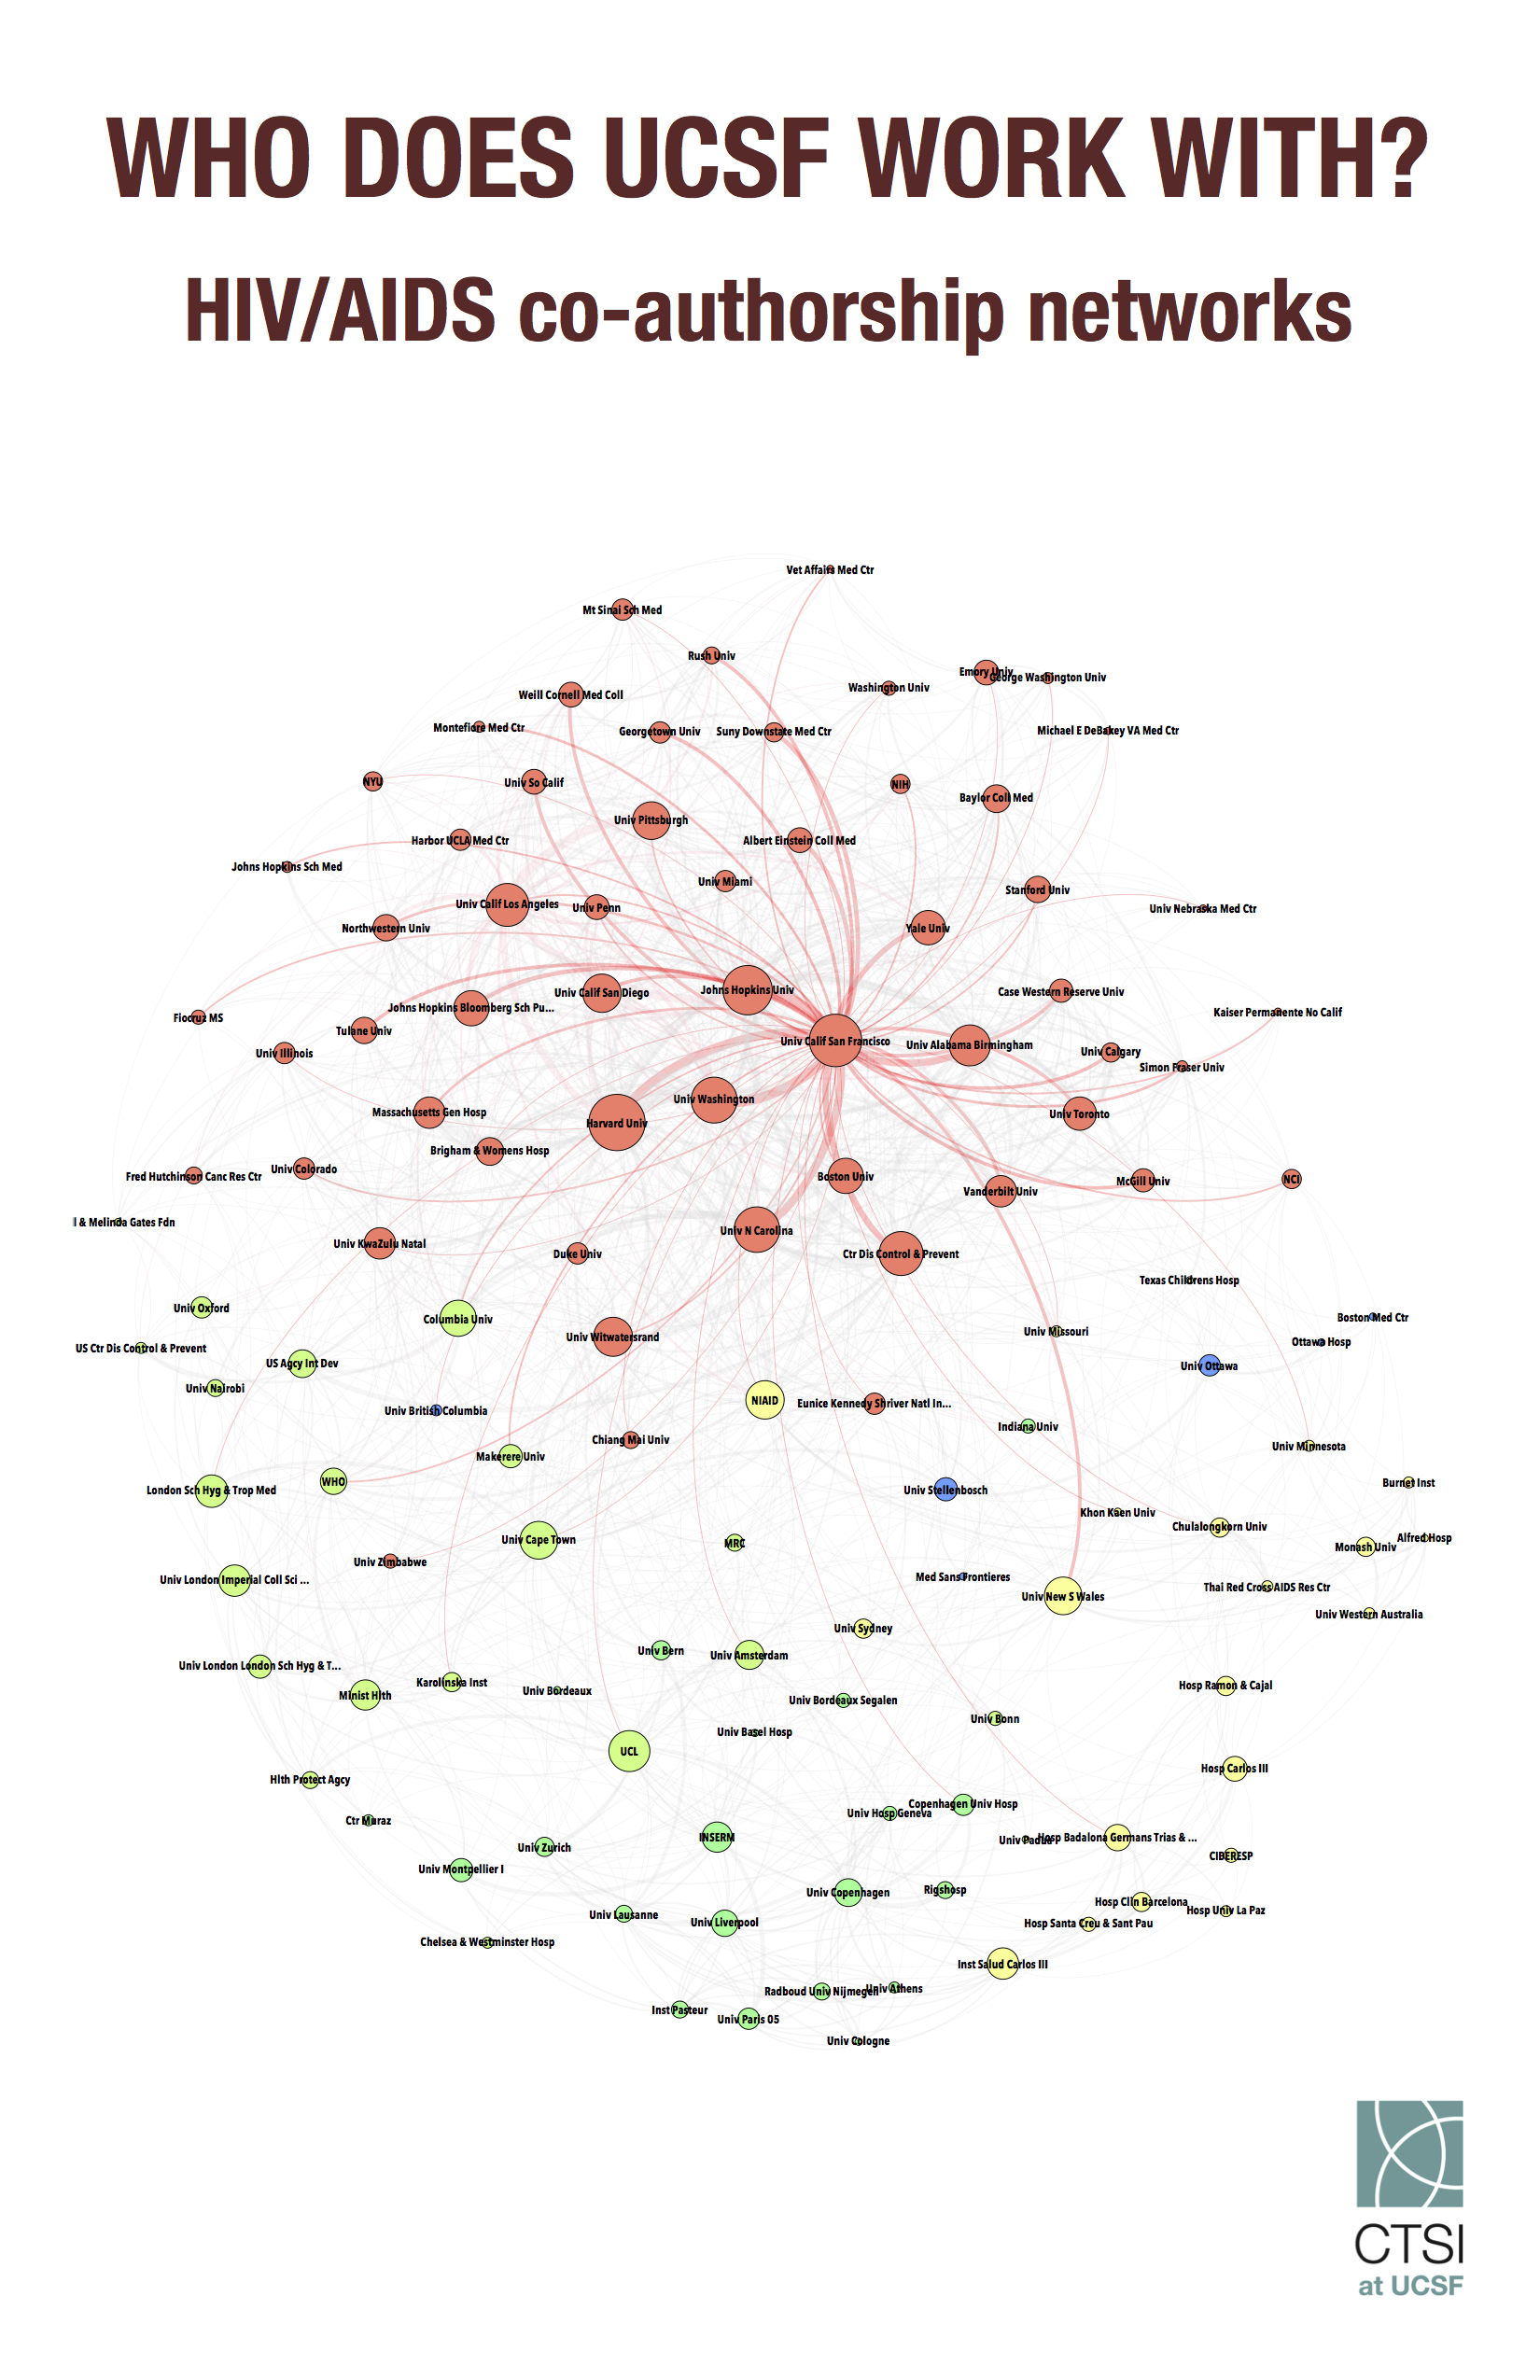
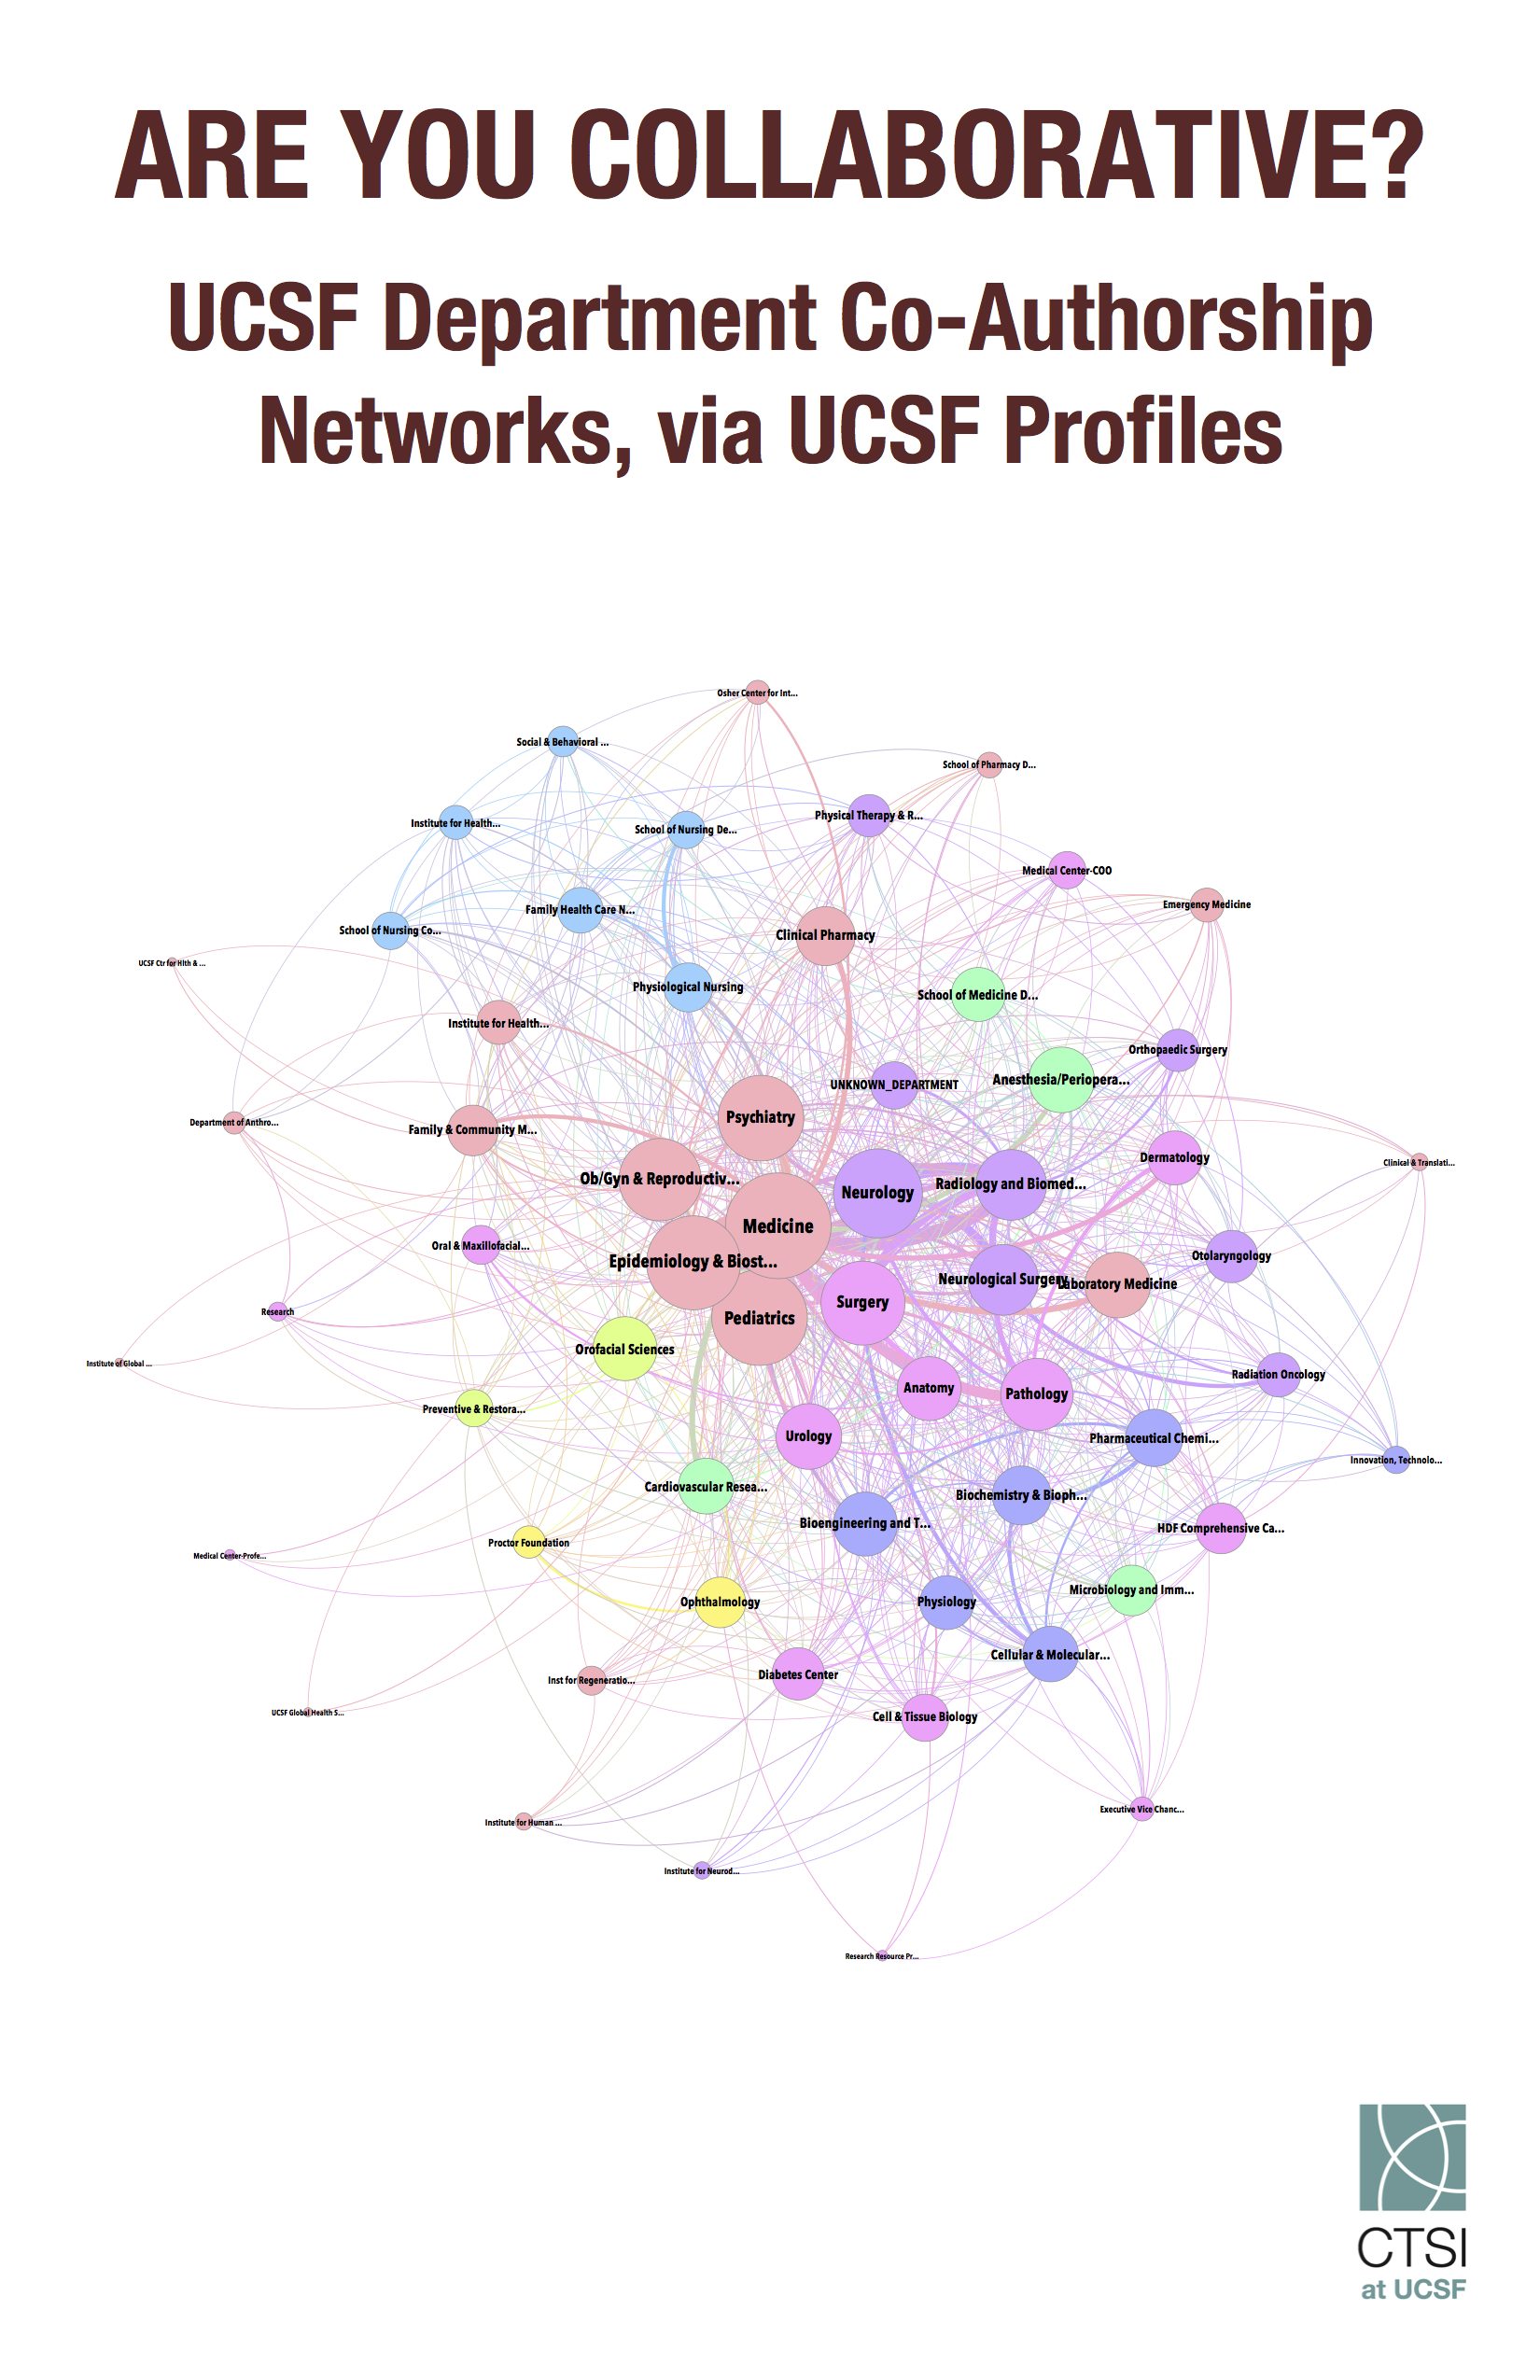
Then I looked at the total universe of dentistry-related publications published in 2013 (see below). Notice a difference? I have to admit that it took me a while to find UCSF in the mess of dots. (If you look at the full-size view, we’re in the medium blue section, next to the pinks.) Of course this says more about the sheer volume of research being published by universities all over the world, than about any lack of cross-institutionally collaborative spirit on our part; in fact I hid over 80% of the institutions in the first image to keep it readable, which accounts for a a good chunk of the difference. But the sheer weight of institutions from Europe, East Asia, and Latin America in this second image that aren’t there in the first is intriguing, and something I’m going to try digging into.
(Details: Institution node sizes indicate the total volume of dentistry-related articles published. Connecting line widths indicate the number of articles co-authored between two institutions. Distance between nodes indicates the tightness of co-authorship networks, and different sets of node colors help distinguish groups of institutions whose researchers frequently co-author together. Of 2,575 institutions that we found, we’re showing only 374 that had 10 or more cross-institutional articles in that time.)
View full-size visualization (PDF)
(And yes, I realize fully well that I’m probably looking at the wrong things here, privileging increasing the count of cross-institutional collaborations as an end in itself, avoiding any consideration of research quality, and giving greater visual weight to institutions that publish more, regardless of the size of the institution or the quality of work. Pretty pictures lie can hide lots of flaws. I hope you’ll bear with me as I publicly iterate through these topics, step by step, hopefully getting just a little bit less dumb every time.)
Additional uninteresting details: I searched Web of Science for dentistry-related articles published in 2013 (i.e. from January 1-December 5, 2013). I began by running a search for any articles published in 2013 matching a number of dentistry-related keywords (dental, dentistry, electrogalvanism, endodontics, jaw relation record, mouth rehabilitation, odontometry, oral, orthodontics, periodontics, prosthodontics, teeth, tooth), then filtered only those that matched the “DENTISTRY ORAL SURGERY MEDICINE” Web of Science category.
The 100 top researcher keywords at UCSF
I was looking to dig into some examples of collaboration patterns in different research areas, when I realized I didn’t even know the basics — what do UCSF researchers actually research?
UCSF Profiles uses PubMed data to extract MeSH keywords for every publication by every UCSF researcher in the system. We can use this to look at the most commonly used MeSH keywords across every researcher’s body of work. There are lots of caveats here (looking at all publications emphasizes past research interests over current ones; we’re not grouping related obscure MeSH terms with more popular ones; MeSH term assignment practices change over time; and this analysis ignores someone’s role as a first, middle, or last author). But this is certainly a start.
Here’s what I found, using the latest UCSF Profiles data:
- 98 researchers have HIV Infections in their top 5 MeSH keywords
- 53 researchers have Breast Neoplasms in their top 5 MeSH keywords
- 42 researchers have Magnetic Resonance Imaging in their top 5 MeSH keywords
- 39 researchers have Tomography, X-Ray Computed in their top 5 MeSH keywords
- 39 researchers have Brain Neoplasms in their top 5 MeSH keywords
- 37 researchers have Internship and Residency in their top 5 MeSH keywords
- 37 researchers have HIV-1 in their top 5 MeSH keywords
- 34 researchers have Alzheimer Disease in their top 5 MeSH keywords
- 33 researchers have Prostatic Neoplasms in their top 5 MeSH keywords
- 32 researchers have Saccharomyces cerevisiae in their top 5 MeSH keywords
- 31 researchers have Brain in their top 5 MeSH keywords
- 31 researchers have Anti-HIV Agents in their top 5 MeSH keywords
- 30 researchers have Neoplasms in their top 5 MeSH keywords
- 30 researchers have Smoking in their top 5 MeSH keywords
- 29 researchers have Diabetes Mellitus, Type 2 in their top 5 MeSH keywords
- 29 researchers have Asthma in their top 5 MeSH keywords
- 28 researchers have Stroke in their top 5 MeSH keywords
- 28 researchers have Sexual Behavior in their top 5 MeSH keywords
- 27 researchers have Myocardial Infarction in their top 5 MeSH keywords
- 27 researchers have Proteins in their top 5 MeSH keywords
- 26 researchers have Neurons in their top 5 MeSH keywords
- 26 researchers have Skin Neoplasms in their top 5 MeSH keywords
- 26 researchers have Antineoplastic Combined Chemotherapy Protocols in their top 5 MeSH keywords
- 25 researchers have Cognition Disorders in their top 5 MeSH keywords
- 25 researchers have Homosexuality, Male in their top 5 MeSH keywords
- 25 researchers have Emergency Service, Hospital in their top 5 MeSH keywords
- 25 researchers have Students, Medical in their top 5 MeSH keywords
- 24 researchers have Obesity in their top 5 MeSH keywords
- 24 researchers have Glioblastoma in their top 5 MeSH keywords
- 23 researchers have Epilepsy in their top 5 MeSH keywords
- 23 researchers have Pancreatic Neoplasms in their top 5 MeSH keywords
- 23 researchers have Dementia in their top 5 MeSH keywords
- 23 researchers have Liver Transplantation in their top 5 MeSH keywords
- 23 researchers have Hispanic Americans in their top 5 MeSH keywords
- 23 researchers have Education, Medical, Undergraduate in their top 5 MeSH keywords
- 22 researchers have Lung in their top 5 MeSH keywords
- 22 researchers have Genetic Predisposition to Disease in their top 5 MeSH keywords
- 22 researchers have Saccharomyces cerevisiae Proteins in their top 5 MeSH keywords
- 22 researchers have Lung Neoplasms in their top 5 MeSH keywords
- 22 researchers have Glioma in their top 5 MeSH keywords
- 21 researchers have Drosophila in their top 5 MeSH keywords
- 21 researchers have Mass Screening in their top 5 MeSH keywords
- 21 researchers have Heart Defects, Congenital in their top 5 MeSH keywords
- 21 researchers have Anti-Bacterial Agents in their top 5 MeSH keywords
- 21 researchers have Liver in their top 5 MeSH keywords
- 21 researchers have Polymorphism, Single Nucleotide in their top 5 MeSH keywords
- 21 researchers have Physician-Patient Relations in their top 5 MeSH keywords
- 21 researchers have Signal Transduction in their top 5 MeSH keywords
- 21 researchers have Primary Health Care in their top 5 MeSH keywords
- 21 researchers have Nerve Tissue Proteins in their top 5 MeSH keywords
- 21 researchers have Stem Cells in their top 5 MeSH keywords
- 21 researchers have Drosophila melanogaster in their top 5 MeSH keywords
- 20 researchers have Colorectal Neoplasms in their top 5 MeSH keywords
- 20 researchers have Stress Disorders, Post-Traumatic in their top 5 MeSH keywords
- 20 researchers have Calcium in their top 5 MeSH keywords
- 20 researchers have Health Services Accessibility in their top 5 MeSH keywords
- 20 researchers have Smoking Cessation in their top 5 MeSH keywords
- 20 researchers have Epithelial Cells in their top 5 MeSH keywords
- 20 researchers have Wounds and Injuries in their top 5 MeSH keywords
- 20 researchers have Drosophila Proteins in their top 5 MeSH keywords
- 20 researchers have Models, Molecular in their top 5 MeSH keywords
- 19 researchers have Magnetic Resonance Spectroscopy in their top 5 MeSH keywords
- 19 researchers have MicroRNAs in their top 5 MeSH keywords
- 19 researchers have Respiratory Distress Syndrome, Adult in their top 5 MeSH keywords
- 19 researchers have Curriculum in their top 5 MeSH keywords
- 19 researchers have Aging in their top 5 MeSH keywords
- 19 researchers have Embryonic Stem Cells in their top 5 MeSH keywords
- 19 researchers have Caenorhabditis elegans in their top 5 MeSH keywords
- 19 researchers have Kidney Transplantation in their top 5 MeSH keywords
- 18 researchers have Heart Failure in their top 5 MeSH keywords
- 18 researchers have Membrane Proteins in their top 5 MeSH keywords
- 18 researchers have Asian Americans in their top 5 MeSH keywords
- 18 researchers have DNA in their top 5 MeSH keywords
- 18 researchers have Tuberculosis in their top 5 MeSH keywords
- 18 researchers have Mental Disorders in their top 5 MeSH keywords
- 18 researchers have Transcription Factors in their top 5 MeSH keywords
- 18 researchers have Coronary Disease in their top 5 MeSH keywords
- 18 researchers have Gene Expression Profiling in their top 5 MeSH keywords
- 17 researchers have DNA-Binding Proteins in their top 5 MeSH keywords
- 17 researchers have CD8-Positive T-Lymphocytes in their top 5 MeSH keywords
- 17 researchers have Skin Diseases in their top 5 MeSH keywords
- 17 researchers have Bacterial Proteins in their top 5 MeSH keywords
- 17 researchers have Apoptosis in their top 5 MeSH keywords
- 17 researchers have Protein-Serine-Threonine Kinases in their top 5 MeSH keywords
- 17 researchers have Homeodomain Proteins in their top 5 MeSH keywords
- 17 researchers have Hypertension in their top 5 MeSH keywords
- 17 researchers have Stress, Psychological in their top 5 MeSH keywords
- 17 researchers have T-Lymphocytes in their top 5 MeSH keywords
- 17 researchers have Abortion, Induced in their top 5 MeSH keywords
- 17 researchers have Schizophrenia in their top 5 MeSH keywords
- 17 researchers have Antineoplastic Agents in their top 5 MeSH keywords
- 17 researchers have Proteomics in their top 5 MeSH keywords
- 17 researchers have Multiple Sclerosis in their top 5 MeSH keywords
- 17 researchers have Teaching in their top 5 MeSH keywords
- 17 researchers have Acquired Immunodeficiency Syndrome in their top 5 MeSH keywords
- 17 researchers have Hepatitis C in their top 5 MeSH keywords
- 17 researchers have Laparoscopy in their top 5 MeSH keywords
- 16 researchers have Muscle, Skeletal in their top 5 MeSH keywords
- 16 researchers have Amyloid beta-Peptides in their top 5 MeSH keywords
- 16 researchers have Ovarian Neoplasms in their top 5 MeSH keywords
Every researcher at UCSF — by department
Co-authorship networks can help us understand internal research collaboration patterns at UCSF. I used data from UCSF Profiles to create a visualization of (almost) every researcher currently at UCSF, and how their intra-UCSF co-authorship networks break out by department.
This visualization by department bears some more investigation than the previous one by school. Department of Medicine researchers are all over, collaborating with a wide variety of external departments. But an initial visual inspection suggests that almost all major departments have co-authorship relationships with members of other departments; some, like neurology, appear to form large standalone clusters, while others, like radiology, are more enmeshed in the work of others. This visualization flattens complex relationships into two dimensions, but it’s a starting point as we work to understand how UCSF collaborates.
Every researcher at UCSF — by school
Co-authorship networks can help us understand internal research collaboration patterns at UCSF. I used data from UCSF Profiles to create a visualization of (almost) every researcher currently at UCSF, and how their intra-UCSF co-authorship networks break out by school.
Unsurprisingly, the School of Medicine takes up most of the space, and the visualization is probably most interesting in terms of what it might suggest about the smaller schools. Researchers from the Schools of Nursing and Dentistry form their own visible clusters, who often work with each other, but also have co-authorship relationships with researchers at the School of Medicine. But I was surprised by the School of Pharmacy, whose researchers form a main clusters in the bottom right, as well as additional clusters in the middle and top left, due to strong collaborative relationships with School of Medicine researchers.
Departmental BFFs: Which UCSF departments publish the most often together?
Some UCSF departments work more closely together than others. I looked at co-authorship patterns in papers published between January 2012 and November 2013, based on data in UCSF Profiles, and pulled out the UCSF departments that collaborate the most frequently. The results aren’t necessarily surprising. The Department of Medicine is huge, and their cross-departmental collaborations make up 8 of the top 10 collaborations, measured by volume. On the flip side, smaller groups with research areas similar to others make up many of the most common collaborations, by percentage; for example, one-third of papers by researchers primarily affiliated with the Proctor Foundation for Research in Opthalmology are co-authored with researchers from the Department of Opthalmology. I wouldn’t have necessarily guessed, however, connections like that between nursing and psychiatry.
Top UCSF cross-departmental collaborations, by volume
- Epidemiology & Biostatistics + Medicine: 365 collaborative papers
- Medicine + Pediatrics: 139 collaborative papers
- Medicine + Psychiatry: 127 collaborative papers
- Neurological Surgery + Neurology: 115 collaborative papers
- Medicine + Pathology: 105 collaborative papers
- Laboratory Medicine + Medicine: 104 collaborative papers
- Medicine + Surgery: 99 collaborative papers
- Neurology + Radiology and Biomedical Imaging: 92 collaborative papers
- Medicine + Radiology and Biomedical Imaging: 90 collaborative papers
- Medicine + Neurology: 86 collaborative papers
Top UCSF cross-departmental collaborations, by percentage
- 64.8% of School of Nursing Dean’s Office papers are co-authored with Physiological Nursing
- 36.8% of Proctor Foundation papers are co-authored with Ophthalmology
- 33.8% of School of Nursing Dean’s Office papers are co-authored with Medicine
- 33.3% of Physiological Nursing papers are co-authored with School of Nursing Dean’s Office
- 33.3% of Institute for Neurodegenerative Disease papers are co-authored with Neurology
- 32.4% of School of Nursing Dean’s Office papers are co-authored with Psychiatry
- 29.8% of Physical Therapy & Rehab Sciences papers are co-authored with Radiology and Biomedical Imaging
- 27.5% of Physiological Nursing papers are co-authored with Medicine
- 25.0% of Epidemiology & Biostatistics papers are co-authored with Medicine
- 22.8% of Family & Community Medicine papers are co-authored with Medicine
Details: Data is drawn from UCSF Profiles, and is based on a list of all publications listed on PubMed published between Jan 2012–Nov 2013, focusing on those whose authors include groups of researchers that have primary affiliations to more than one UCSF department. We counted only those publications from researchers with a listed department, and for the purposes of counting top cross-departmental collaborations by percentage, only those collaborations that generated 10 or more papers during the time period. No attempt was made to account for the widely varying sizes and scopes of different departments, the fact that researchers may have multiple departmental affiliations, or the fact that some publications may have been authored before the researchers were affiliated with their current primary departments at UCSF.
Photo: “Glasgow’s own superheroes having a smoke outside the Counting House” by Stephen Fyfe/Flickr, under CC-BY-NC-ND
UCSF’s top 20 most diverse internally-collaborative departments
When UCSF researchers collaborate between departments, how diverse are the collaborations? Here are the top 20 UCSF departments, ranked by the average numbers of UCSF departments their multi-departmental papers include as co-authors (from among the 39 departments whose researchers had a total of 25+ multi-departmental publications published between January 2012 and November 2013).
Details: Data is drawn from UCSF Profiles, and is based on a list of all publications listed on PubMed published between Jan 2012–Nov 2013 whose authors include groups of researchers with primary affiliations to more than one UCSF department. We counted only those publications from researchers with a listed department, and only those departments whose current associated researchers published 25+ publications in conjunction with current members of other UCSF departments between Jan 2012–Nov 2013. No attempt was made to account for the widely varying sizes and scopes of different departments, the fact that researchers may have multiple departmental affiliations, or the fact that some publications may have been authored before the researchers were affiliated with their current primary departments at UCSF. These are the top 20 departments, out of a total of 39 that match our criteria.
- Physiological Nursing: co-authors from avg. 2.57 other UCSF departments, among 116 multi-department papers
- School of Nursing Dean’s Office: co-authors from avg. 2.44 other UCSF departments, among 52 multi-department papers
- Anesthesia/Perioperative Care: co-authors from avg. 1.84 other UCSF departments, among 69 multi-department papers
- Physiology: co-authors from avg. 1.83 other UCSF departments, among 29 multi-department papers
- Family Health Care Nursing: co-authors from avg. 1.64 other UCSF departments, among 47 multi-department papers
- Laboratory Medicine: co-authors from avg. 1.63 other UCSF departments, among 104 multi-department papers
- Pharmaceutical Chemistry: co-authors from avg. 1.63 other UCSF departments, among 120 multi-department papers
- Pathology: co-authors from avg. 1.62 other UCSF departments, among 234 multi-department papers
- Radiation Oncology: co-authors from avg. 1.60 other UCSF departments, among 53 multi-department papers
- Microbiology and Immunology: co-authors from avg. 1.57 other UCSF departments, among 49 multi-department papers
- Cellular & Molecular Pharmacology: co-authors from avg. 1.57 other UCSF departments, among 74 multi-department papers
- Orofacial Sciences: co-authors from avg. 1.57 other UCSF departments, among 53 multi-department papers
- HDF Comprehensive Cancer Center: co-authors from avg. 1.55 other UCSF departments, among 31 multi-department papers
- Anatomy: co-authors from avg. 1.55 other UCSF departments, among 55 multi-department papers
- Pediatrics: co-authors from avg. 1.53 other UCSF departments, among 321 multi-department papers
- School of Nursing Community Health Systems: co-authors from avg. 1.52 other UCSF departments, among 31 multi-department papers
- Surgery: co-authors from avg. 1.50 other UCSF departments, among 227 multi-department papers
- Biochemistry & Biophysics: co-authors from avg. 1.49 other UCSF departments, among 75 multi-department papers
- Neurological Surgery: co-authors from avg. 1.47 other UCSF departments, among 393 multi-department papers
- Cardiovascular Research Institute: co-authors from avg. 1.45 other UCSF departments, among 53 multi-department papers
UCSF’s top 20 internally collaborative departments
Some UCSF departments consistently reach out out to collaborate with other members of the UCSF community. Here are the top 20 UCSF departments whose researchers have the highest proportion of publications co-authored with members of other UCSF departments from among departments whose researchers had a total of 100+ publications published between January 2012 and November 2013.
Details: Data is drawn from UCSF Profiles, and is based on a list of all publications listed on PubMed published between Jan 2012–Nov 2013 whose authors include groups of researchers with primary affiliations to more than one UCSF department. We counted only publications from researchers with a listed department, and departments with 100+ publications by current associated researchers between Jan 2012–Nov 2013. No attempt was made to account for the widely varying sizes and scopes of different departments, the fact that researchers may have multiple departmental affiliations, or the fact that some publications may have been authored before the researchers were affiliated with their current primary departments at UCSF. These are the top 20 departments, out of a total of 42 that match our criteria.
- Epidemiology & Biostatistics: 51.1%
424 of 829 publications co-authored with other UCSF departments - Proctor Foundation: 50.3%
82 of 163 publications co-authored with other UCSF departments - Pathology: 49.2%
234 of 476 publications co-authored with other UCSF departments - Physiological Nursing: 45.5%
116 of 255 publications co-authored with other UCSF departments - Neurological Surgery: 43.9%
393 of 896 publications co-authored with other UCSF departments - Orofacial Sciences: 42.7%
53 of 124 publications co-authored with other UCSF departments - Family Health Care Nursing: 37.0%
47 of 127 publications co-authored with other UCSF departments - Clinical Pharmacy: 36.9%
58 of 157 publications co-authored with other UCSF departments - Family & Community Medicine: 36.2%
54 of 149 publications co-authored with other UCSF departments - Radiology and Biomedical Imaging: 35.0%
449 of 1284 publications co-authored with other UCSF departments - Psychiatry: 33.5%
252 of 753 publications co-authored with other UCSF departments - Pharmaceutical Chemistry: 33.3%
120 of 360 publications co-authored with other UCSF departments - Pediatrics: 32.5%
321 of 989 publications co-authored with other UCSF departments - Anatomy: 31.8%
55 of 173 publications co-authored with other UCSF departments - Ob/Gyn & Reproductive Sciences: 30.7%
185 of 602 publications co-authored with other UCSF departments - Cell & Tissue Biology: 30.5%
32 of 105 publications co-authored with other UCSF departments - Dermatology: 30.1%
129 of 429 publications co-authored with other UCSF departments - Medicine: 27.7%
1257 of 4545 publications co-authored with other UCSF departments - Biochemistry & Biophysics: 26.8%
75 of 280 publications co-authored with other UCSF departments - Neurology: 26.8%
400 of 1495 publications co-authored with other UCSF departments
HIV/AIDS research collaborations, visualized
Co-authorship networks give us a sense of the strength of research collaborations. We used co-authorship data to visualize how top HIV/AIDS research institutions worked with one another, based on publications from June 2012 to September 2013. UCSF collaborations are indicated via red lines.
Visualization details: Data includes all known publications related to HIV/AIDS between June 2012 and September 2013 that includes co-authors from two or more institutions. We map each author to their institution, and the size of each institution corresponds with the number of HIV/AIDS publications its members co-authored in that time; only the most prolific institutions are shown to ensure readability of the image. The width of the lines connecting institutions corresponds to the number of publications that include co-authors from both of these institutions. Collaborations with UCSF researchers are indicated with red lines. Colors indicate clusters of institutions that often publish collaboratively, based on network modularity.
UCSF collaborations, visualized
UCSF researchers often work closely with one another, across departments. We used data from UCSF Profiles to visualize how different departments work together, based on co-authorship patterns.
Visualization details: Data is drawn from UCSF Profiles, and includes all publications co-authored by current UCSF researchers from two more departments and listed on PubMed. The size of each department corresponds with the number of publications that members have published that include partnerships with other departments. The width of the lines connecting departments corresponds to the number of publications between two departments. Colors indicate clusters of departments that often publish collaboratively, based on network modularity. No scaling is done to account for varying sizes of different departments.


